Sales Territory Intelligence Dashboard
Replaced manual spreadsheet tracking with an interactive dashboard for managing thousands of law firm territories across a national sales team.
Manual Excel spreadsheets updated weekly. No visibility into territory overlap or unassigned firms. Sales managers spent hours each week reconciling rep assignments and couldn't answer basic questions like 'Which firms in Georgia have no rep assigned?'
The Challenge
The client's sales team managed relationships with thousands of law firms across the United States. Territory assignments, rep coverage, and firm relationships were all tracked in a set of interconnected Excel spreadsheets that had grown organically over several years.
The problems were predictable but painful. Multiple reps would sometimes pursue the same firm without knowing it. Large geographic gaps went unnoticed for months. When a rep left, reassigning their book of business took days of manual work. And the VP of Sales couldn't get a simple answer to "how are we covering the Southeast?" without asking someone to pull and pivot the data.
Management had tried color-coding the spreadsheets, adding conditional formatting rules, and even splitting into regional files. Each fix created new problems. The data was technically there, but nobody could see it.
What We Built
We built a full-stack territory intelligence platform that ingests the firm database and transforms it into an interactive, map-driven dashboard.
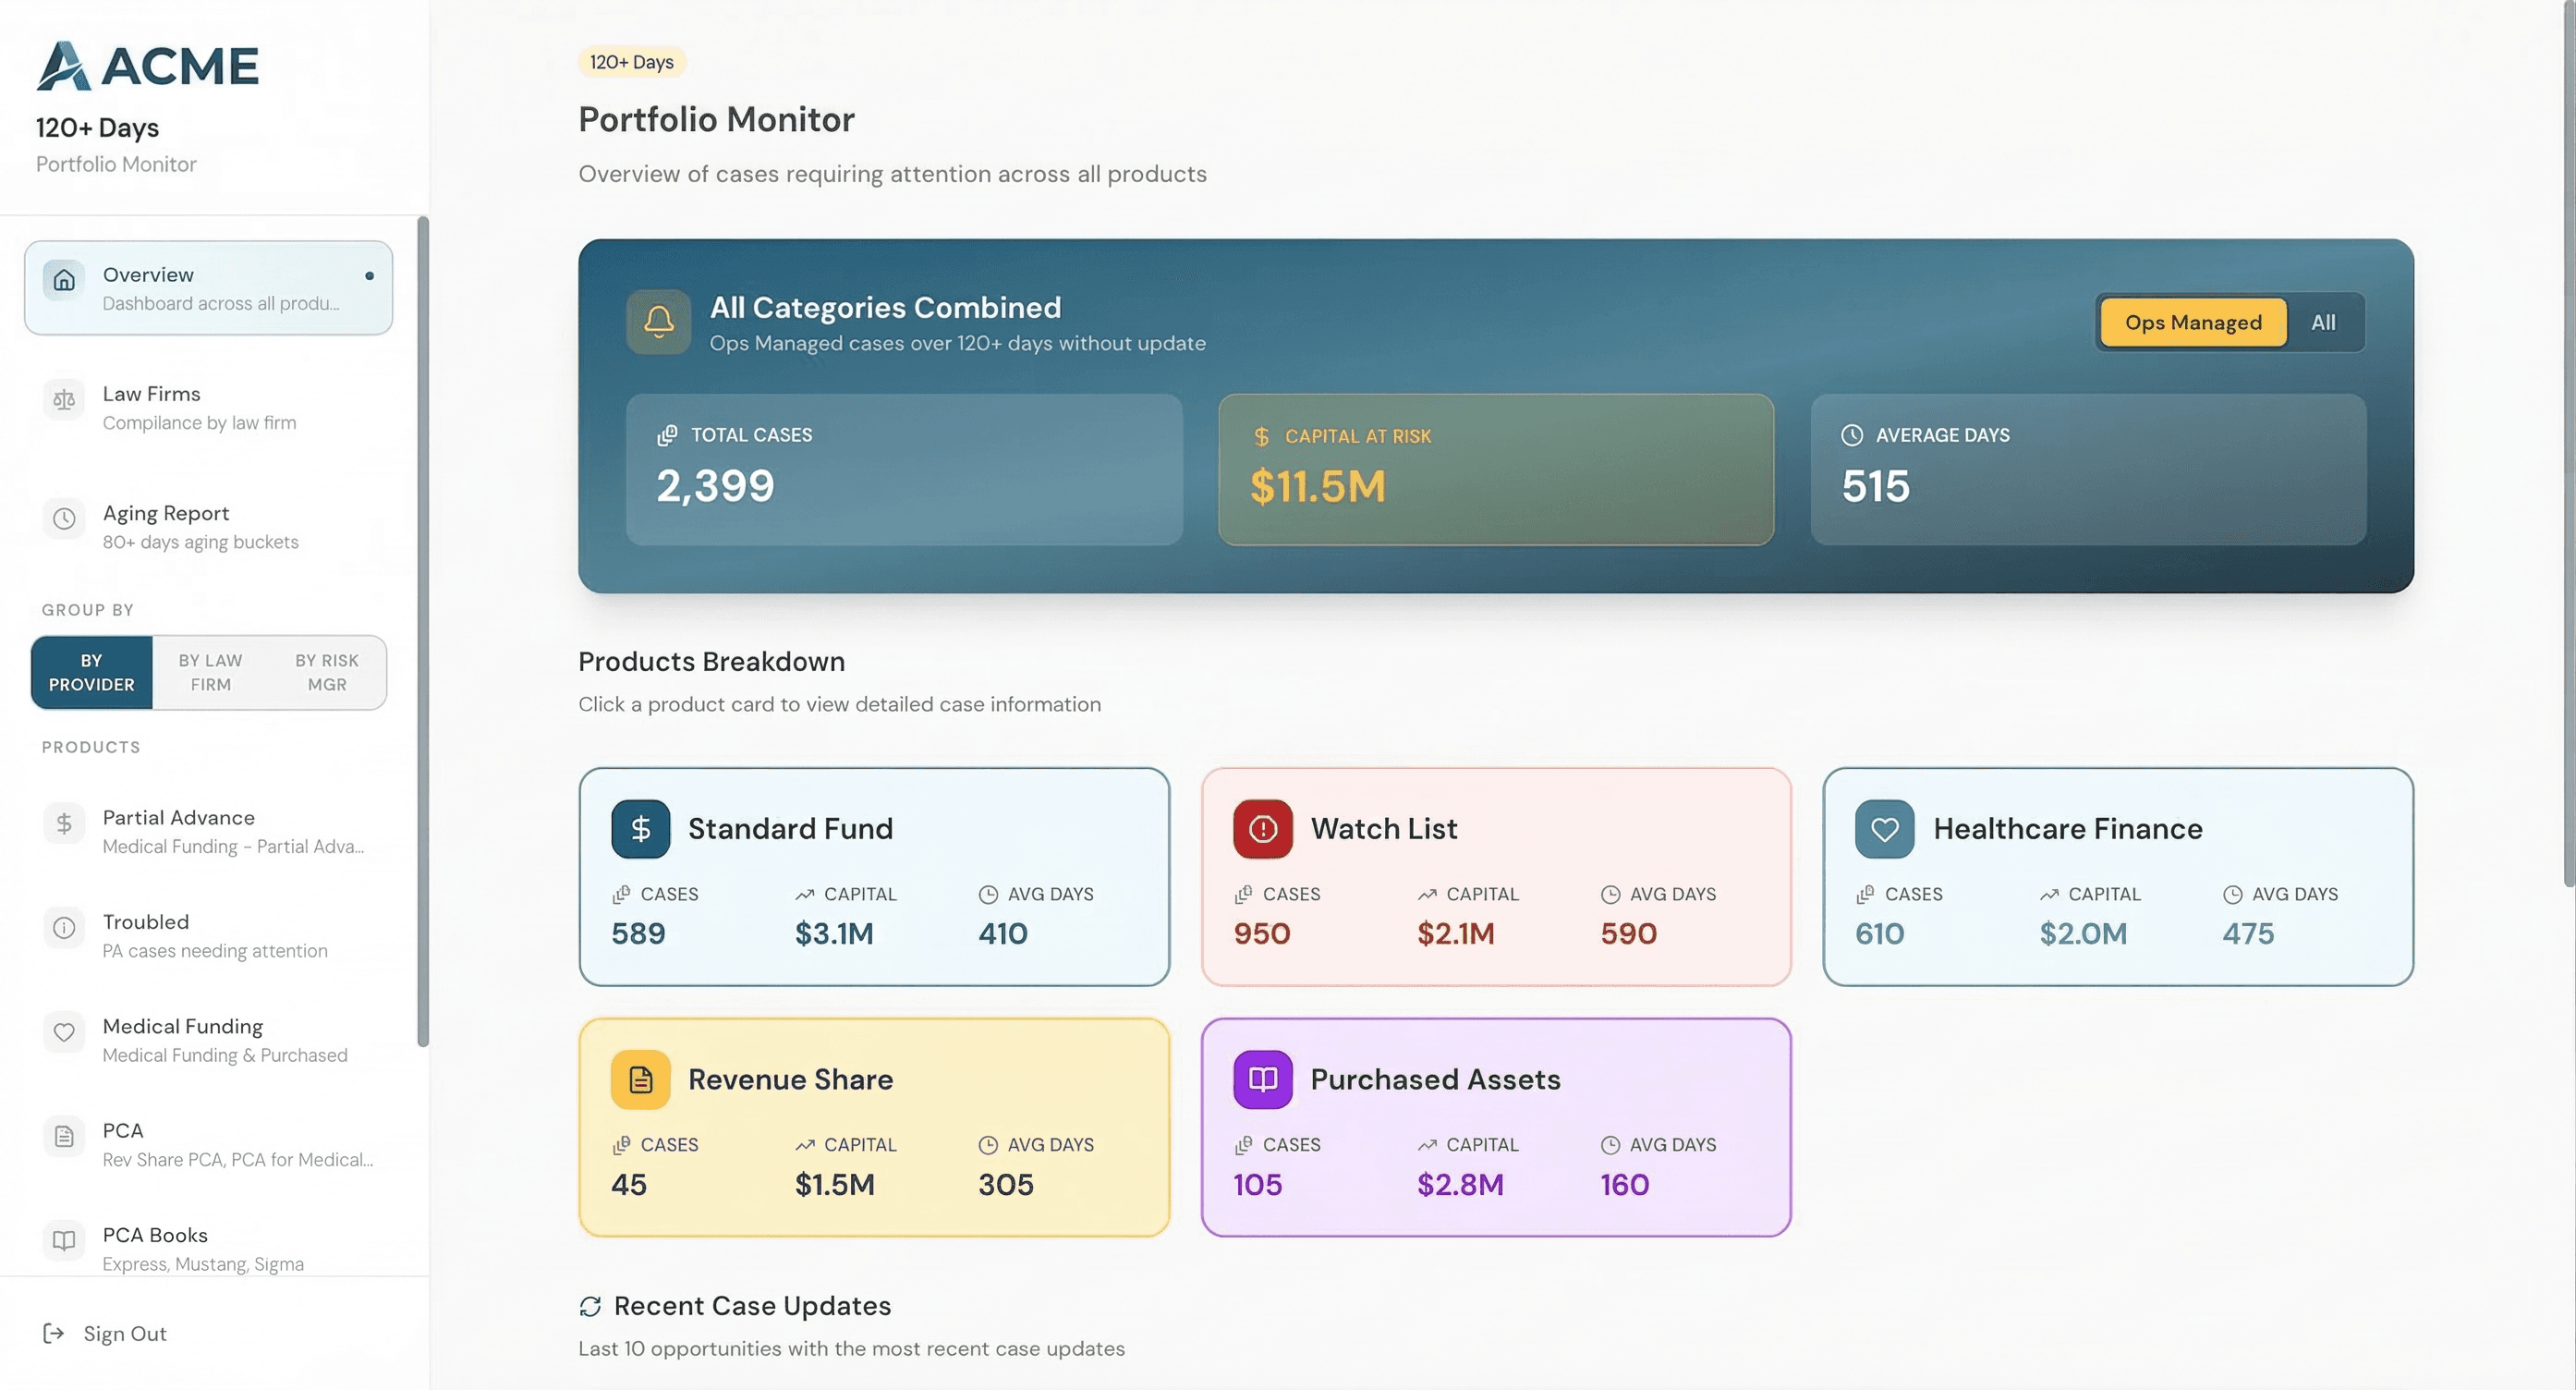
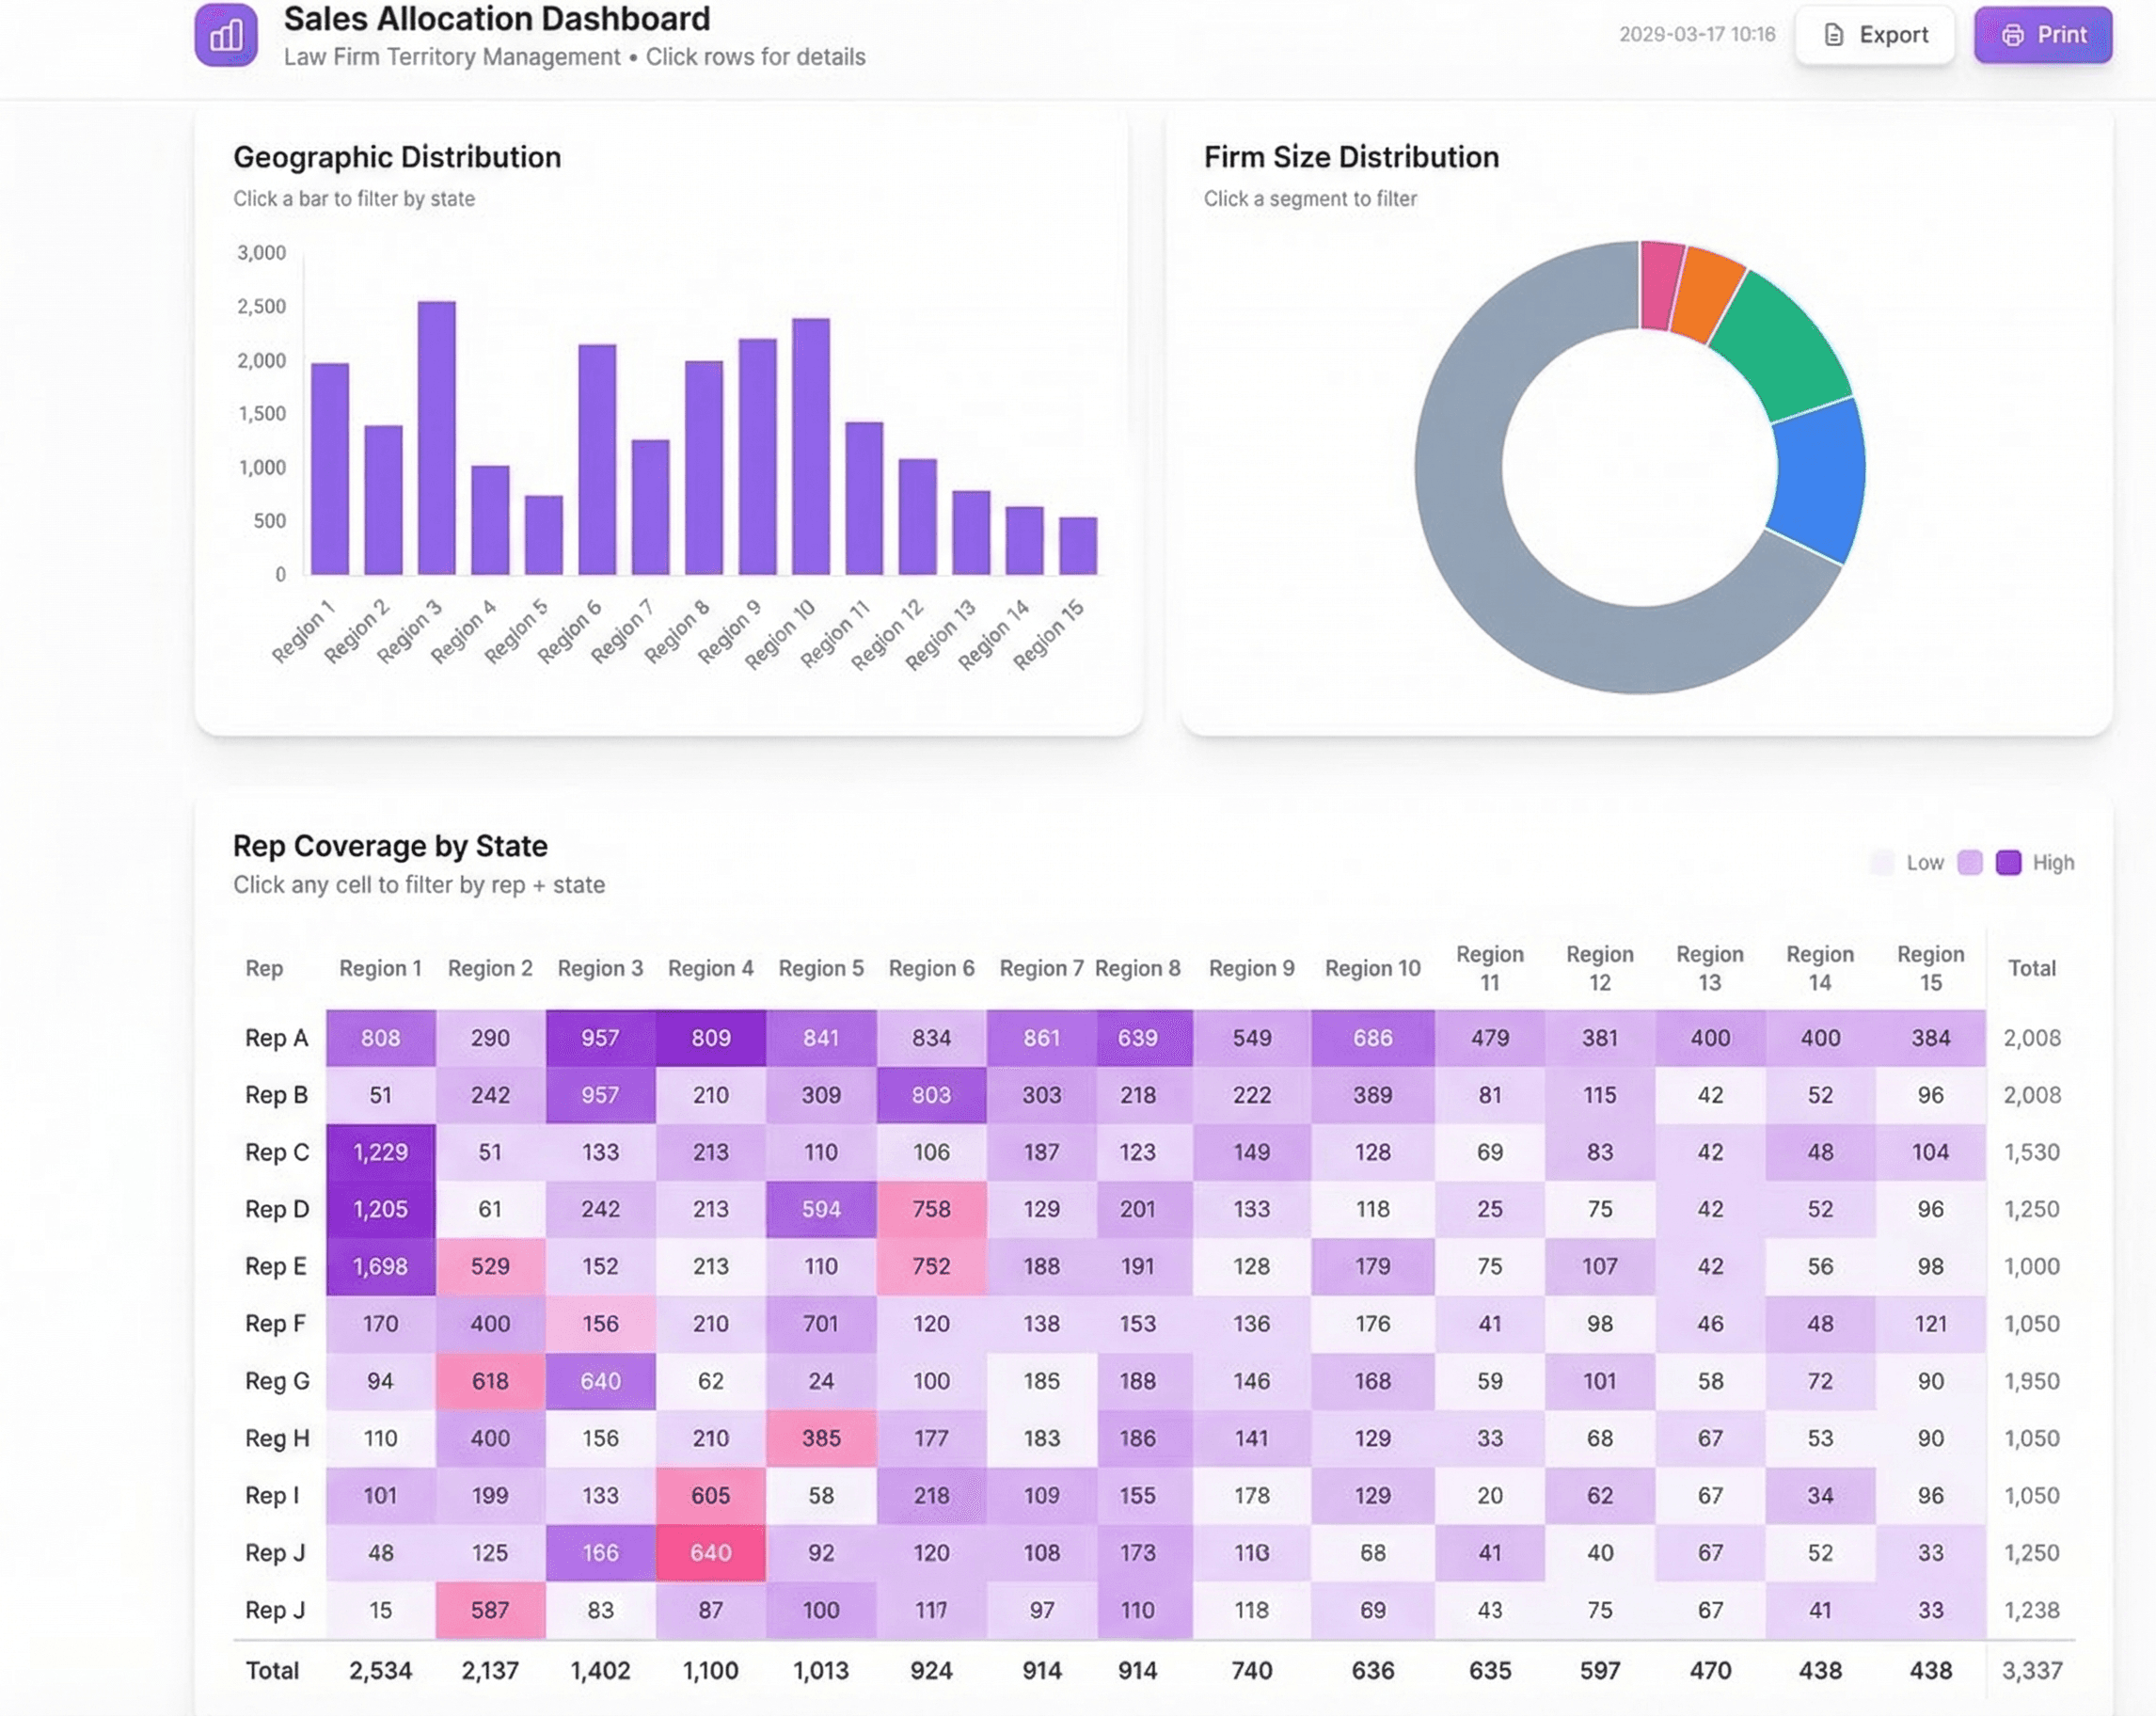
The core view is a geographic heatmap showing rep coverage density by state. Sales managers can instantly spot gaps, overlaps, and concentration risk. Each state is color-coded by assignment density, and clicking into a state reveals the individual firms with their assigned rep, last contact date, and engagement status.
The territory map uses clustered markers to handle the volume. At the national level, you see aggregated clusters. Zoom into a metro area and individual firms appear with color-coded pins by assigned rep. The visual immediately answers questions that used to require 30 minutes of spreadsheet work.
We added a rep management panel where managers can view each rep's full book of business, sort by revenue potential or last contact, and reassign firms with drag-and-drop. Bulk operations handle territory restructuring, so when a rep leaves, their firms can be redistributed in minutes instead of days.
The search and filter system supports multi-dimensional queries: find all unassigned firms in Texas with over 50 attorneys, or all firms in a specific practice area that haven't been contacted in 90 days. These queries that used to require custom Excel formulas now take seconds.
Real-time data sync means updates made by one user are immediately visible to everyone. No more version conflicts, no more "which spreadsheet is the latest?"
Results
The dashboard went from concept to production in under four weeks. Within the first week of deployment, the sales team identified hundreds of firms that had fallen through the cracks with no rep assigned. They also discovered hundreds more that were being double-covered by multiple reps.
Territory restructuring that previously took 2-3 days now completes in under an hour. The VP of Sales runs a Monday morning territory review directly from the dashboard, replacing a meeting that used to require pre-work from two analysts.
The team has since expanded the platform to include pipeline tracking and activity logging, turning what started as a territory map into their primary sales operations tool.
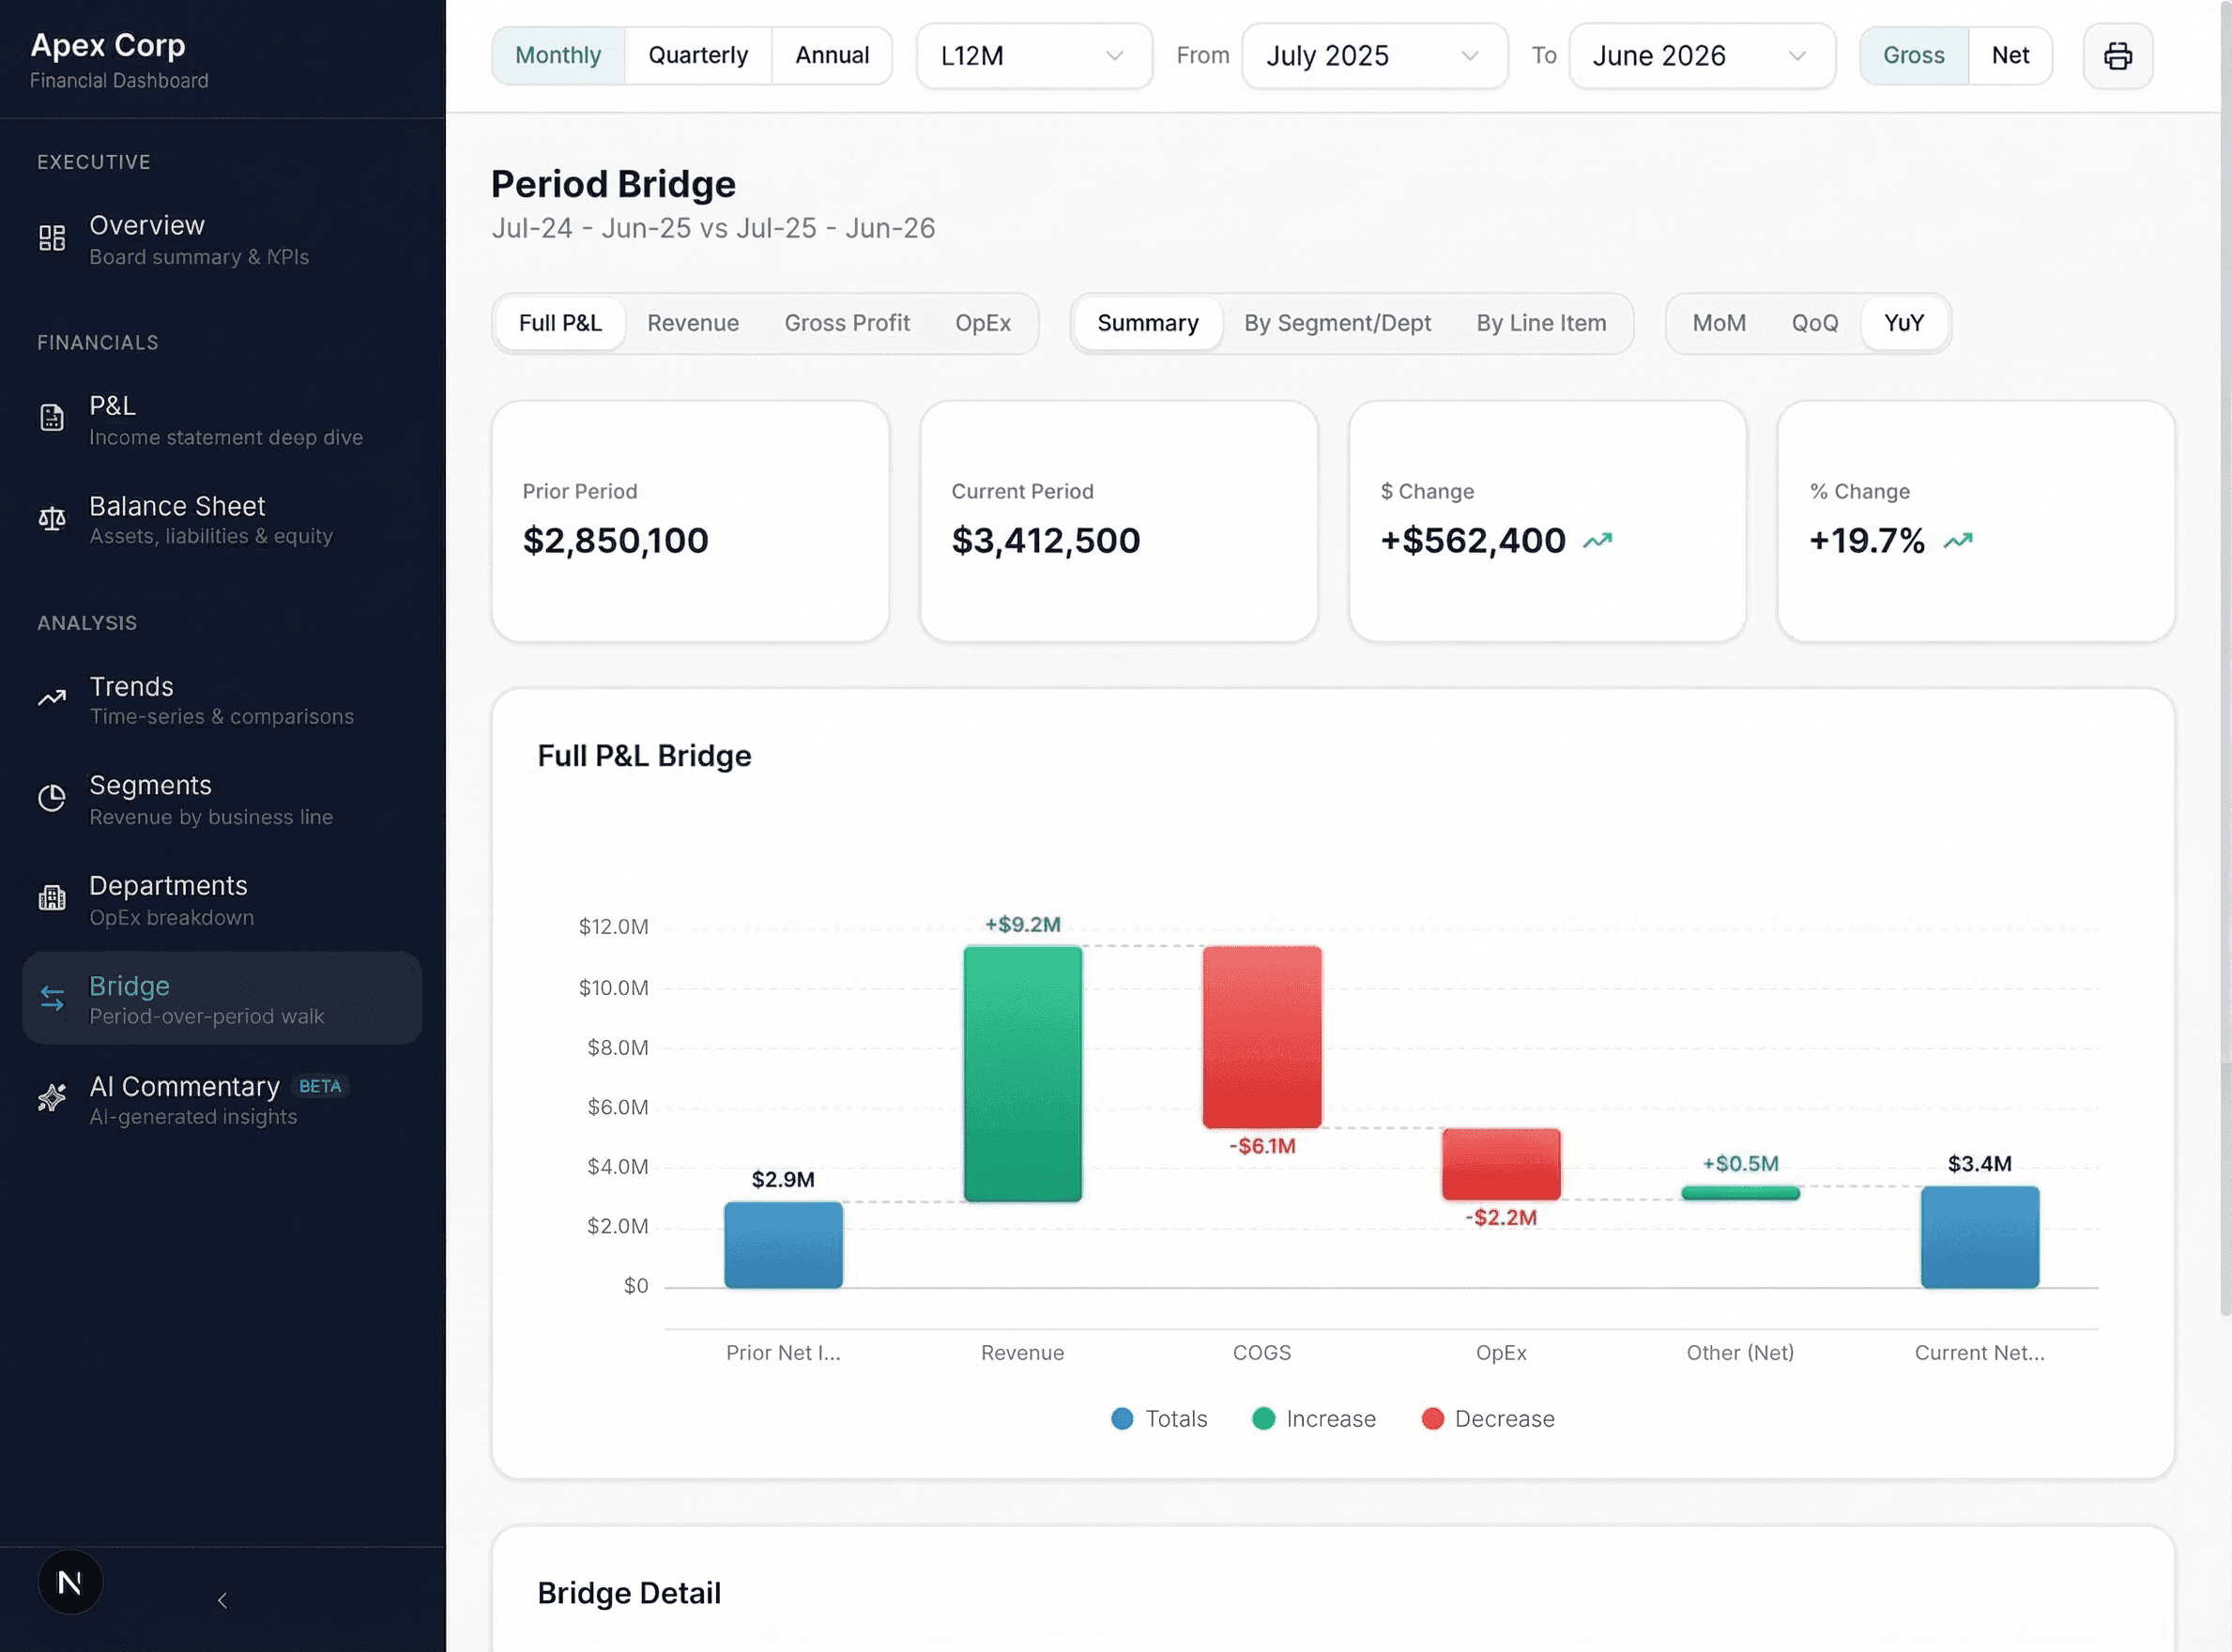
Product Screenshots
Need something like this built?
I build custom dashboards and analytics tools for finance teams. Let's talk about what you're working with.
Book a 30-Minute Conversationor email us at hello@strategiq.so