From VBA Macro to Real-Time Payment Analytics
Replaced a fragile VBA macro system with a modern analytics dashboard processing tens of thousands of monthly transactions across hundreds of merchants.
A chain of VBA macros running in Excel processed monthly data files. The macros took 45 minutes to run, broke frequently with format changes, and produced static reports that couldn't be filtered or explored. Only one person knew how to fix the macros when they broke.
The Challenge
The client ran a financial services company processing transaction data from hundreds of merchants nationwide. Every month, a detailed data file arrived containing tens of thousands of line items showing transaction volumes, fee structures, and revenue by merchant.
The entire analytical workflow ran through a chain of Excel VBA macros built by a single analyst over three years. The macros imported the raw file, applied merchant mappings, calculated net revenue, generated summary reports, and produced a set of pivot tables for management review.
The system worked, until it didn't. Format changes in the monthly data files broke the macros every few months. A column shift, a new transaction type, or an extra header row would cause a silent failure where the macro would finish running but produce incorrect results. The analyst who built the macros spent 15-20% of his time just maintaining them.
The bigger limitation was analytical flexibility. Management wanted to answer questions the macros weren't designed for: Which merchants are declining? Where are the geographic gaps? What's the revenue concentration risk? Each new question required modifications to the VBA code, which took days and introduced new fragility.
When the analyst who maintained the macros gave notice, replacing the system became urgent.
What We Built
We built a modern analytics platform that replaces the entire VBA pipeline with an automated data processing engine and interactive dashboard.
The data pipeline ingests the monthly data file (CSV format), validates the structure, applies merchant mappings, and loads the processed data into PostgreSQL in under 30 seconds. The pipeline handles format variations gracefully: new columns are captured without breaking existing logic, and structural anomalies trigger warnings instead of failures.
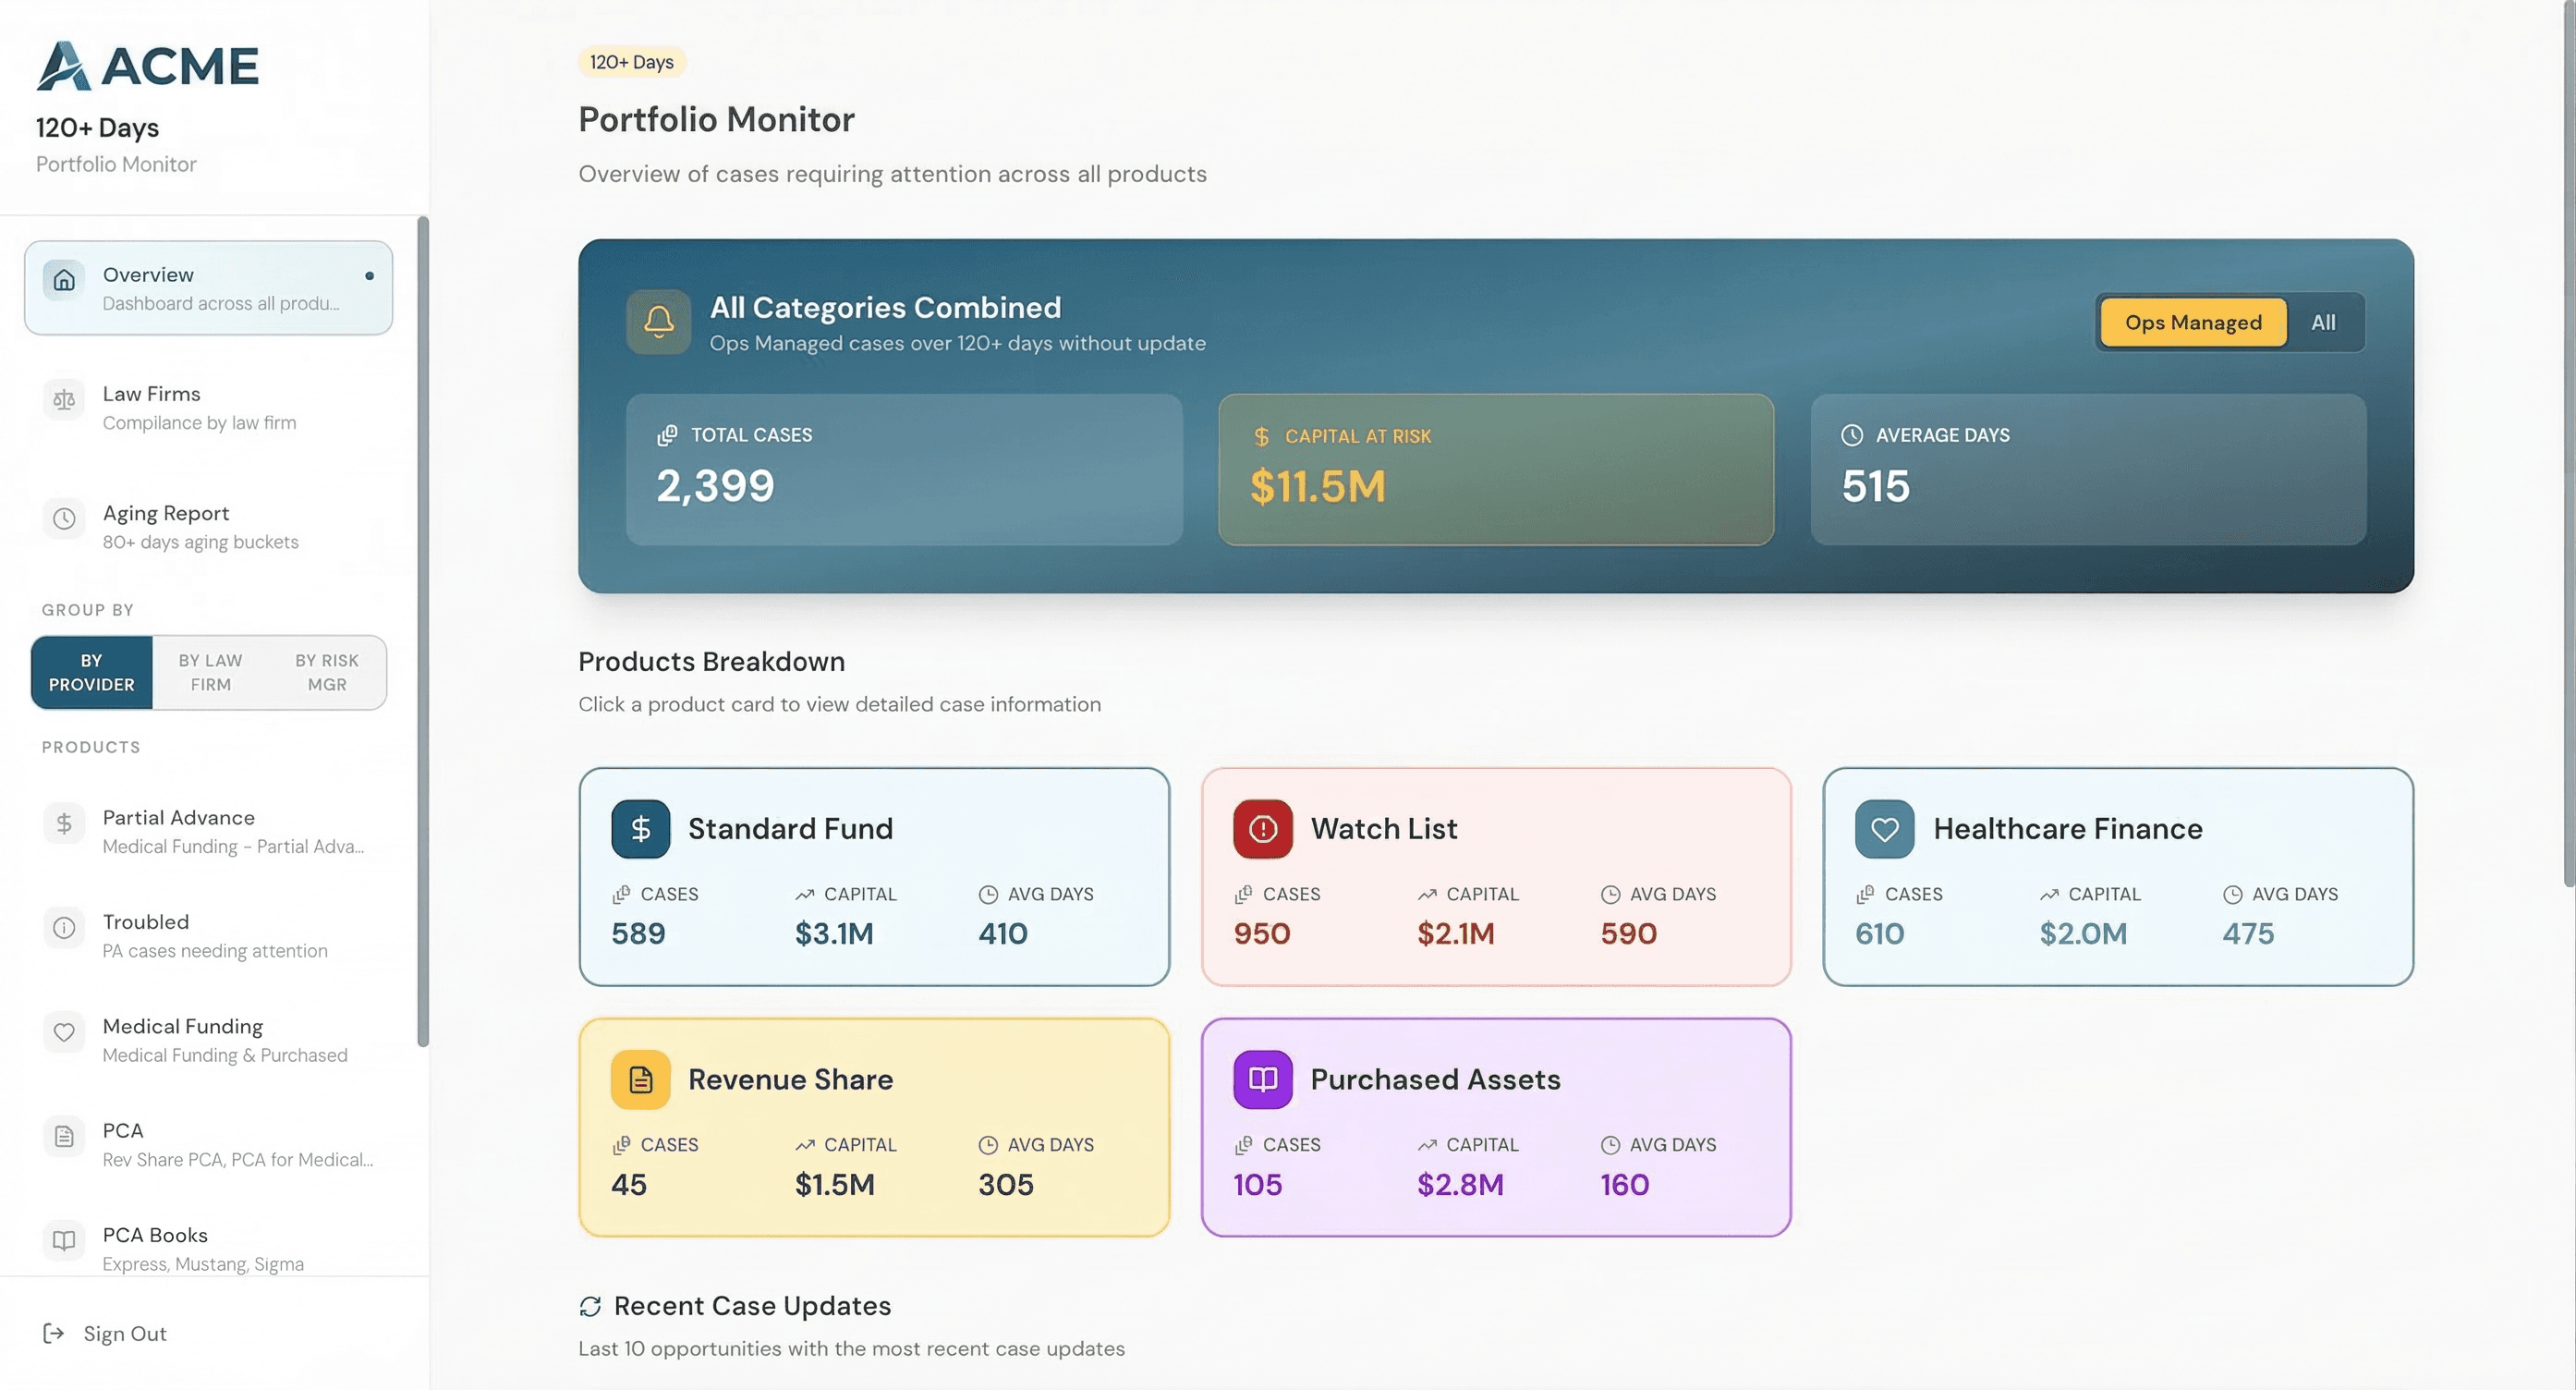
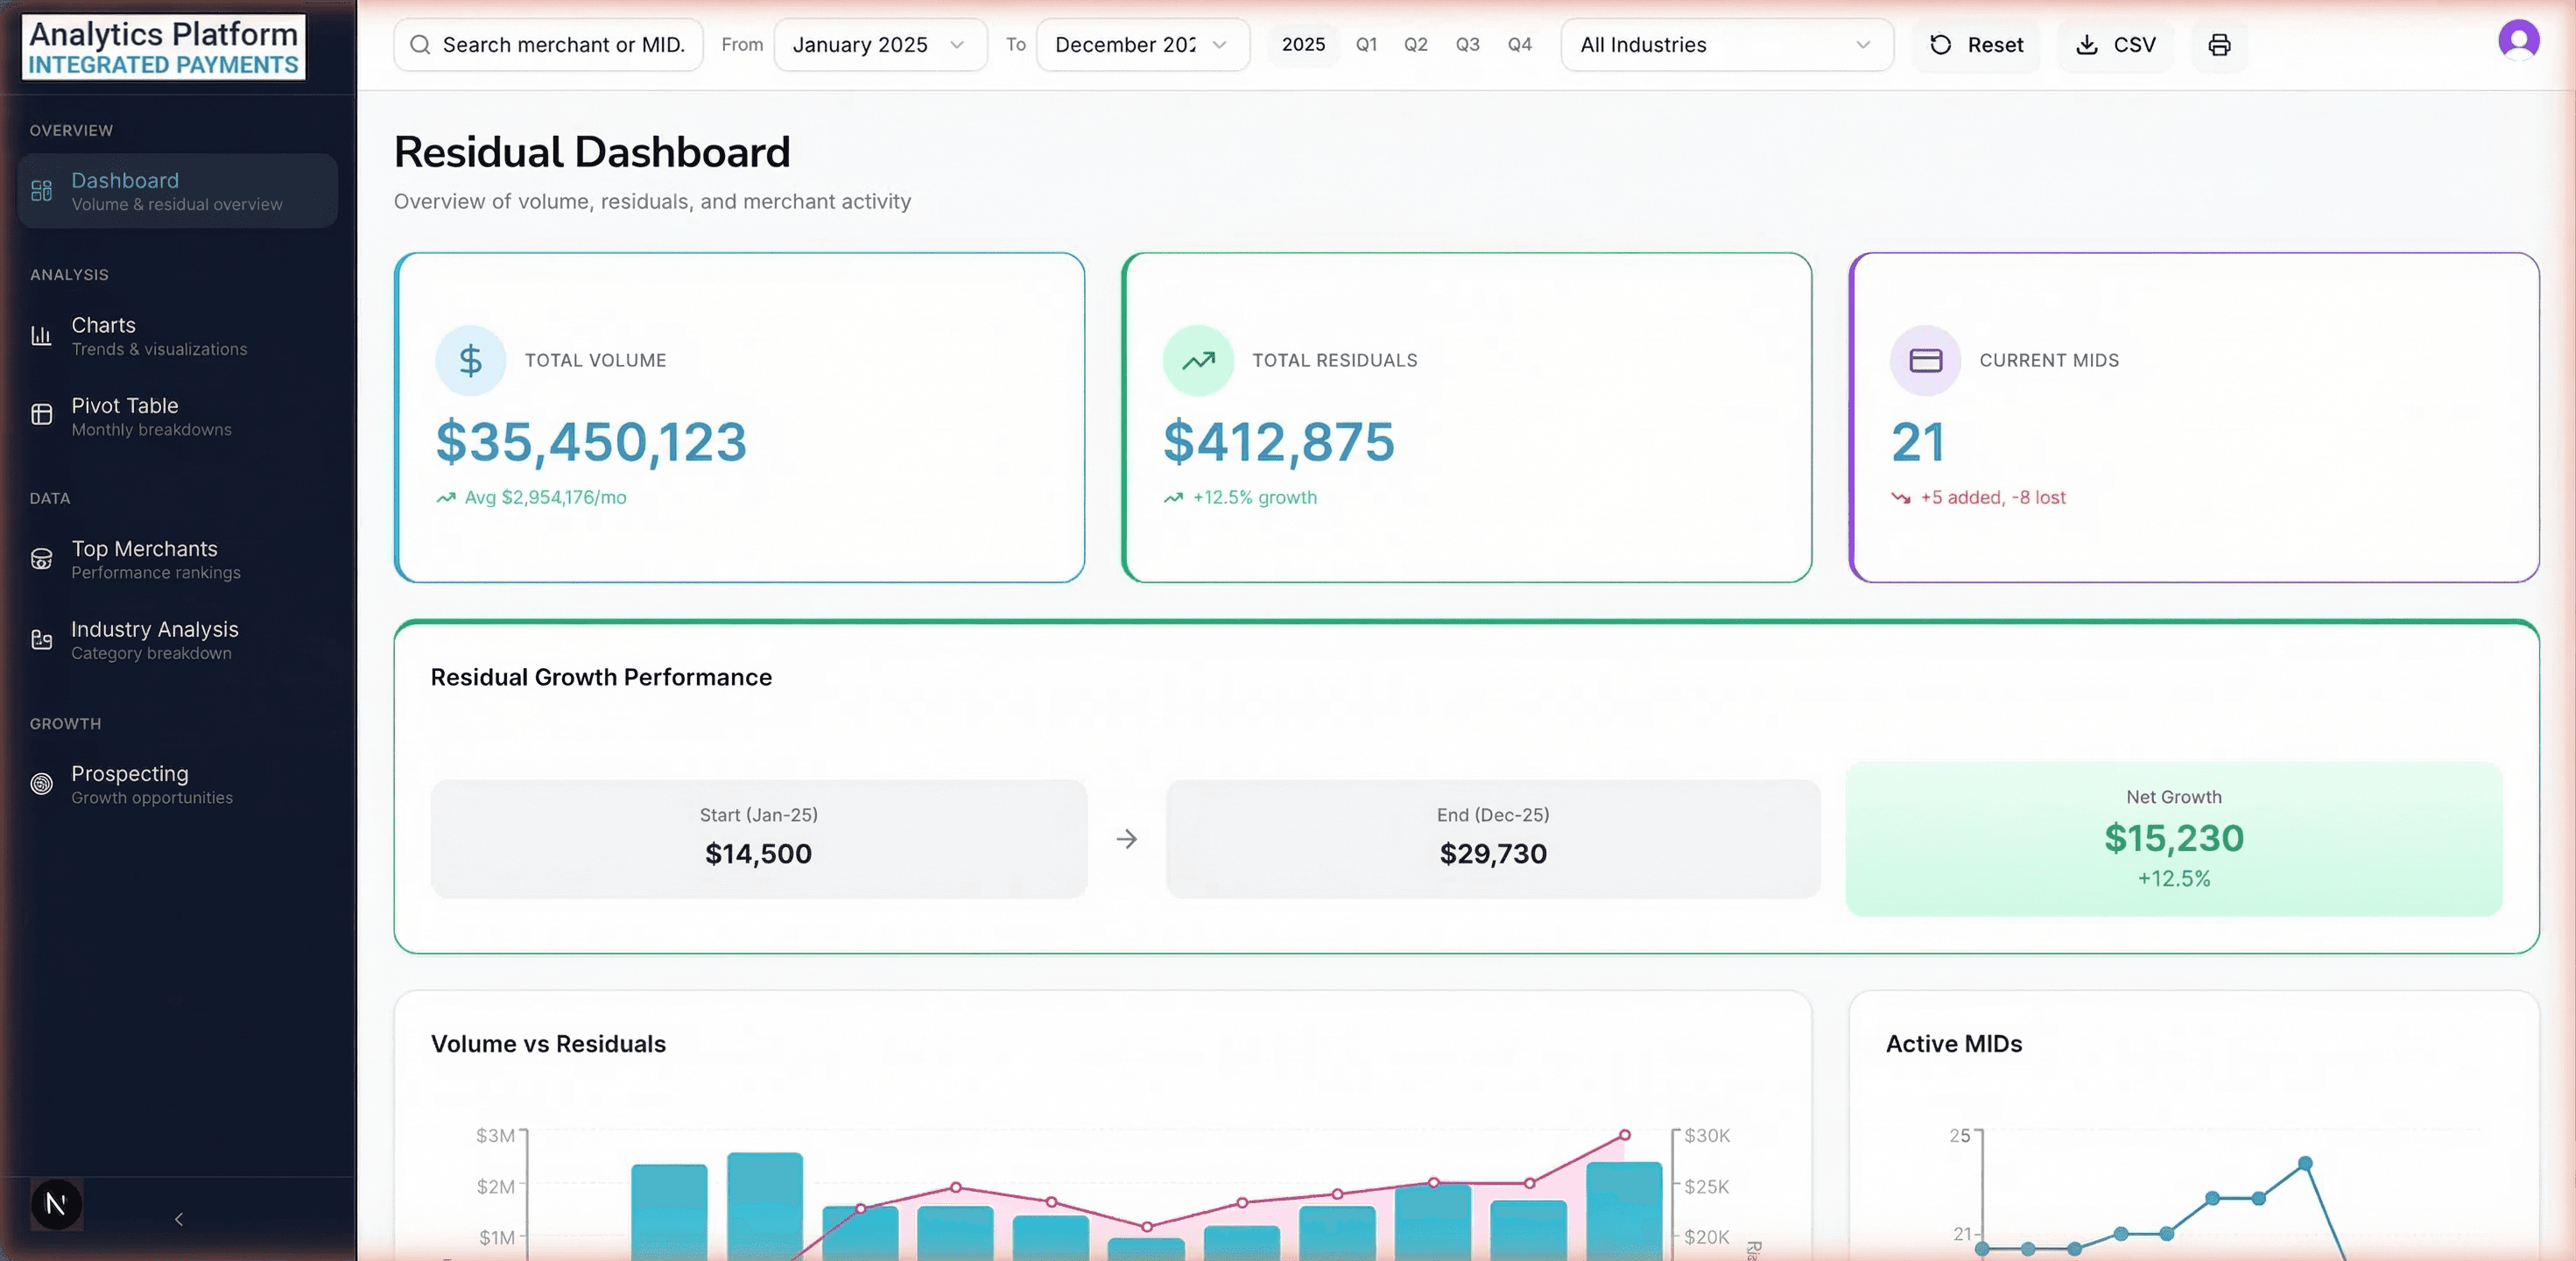
The executive overview shows the numbers that matter most: total monthly revenue, transaction volume, average revenue per merchant, and month-over-month growth. Each KPI card includes a sparkline showing the 12-month trend and a color-coded indicator for direction. Leadership gets the full picture in a single glance.
The charts page provides the analytical depth that was impossible with the VBA system. Revenue trend lines show seasonal patterns and growth trajectories. Product mix charts reveal how the revenue composition is shifting. A merchant cohort analysis tracks how revenue from merchants acquired in different periods is performing over time.
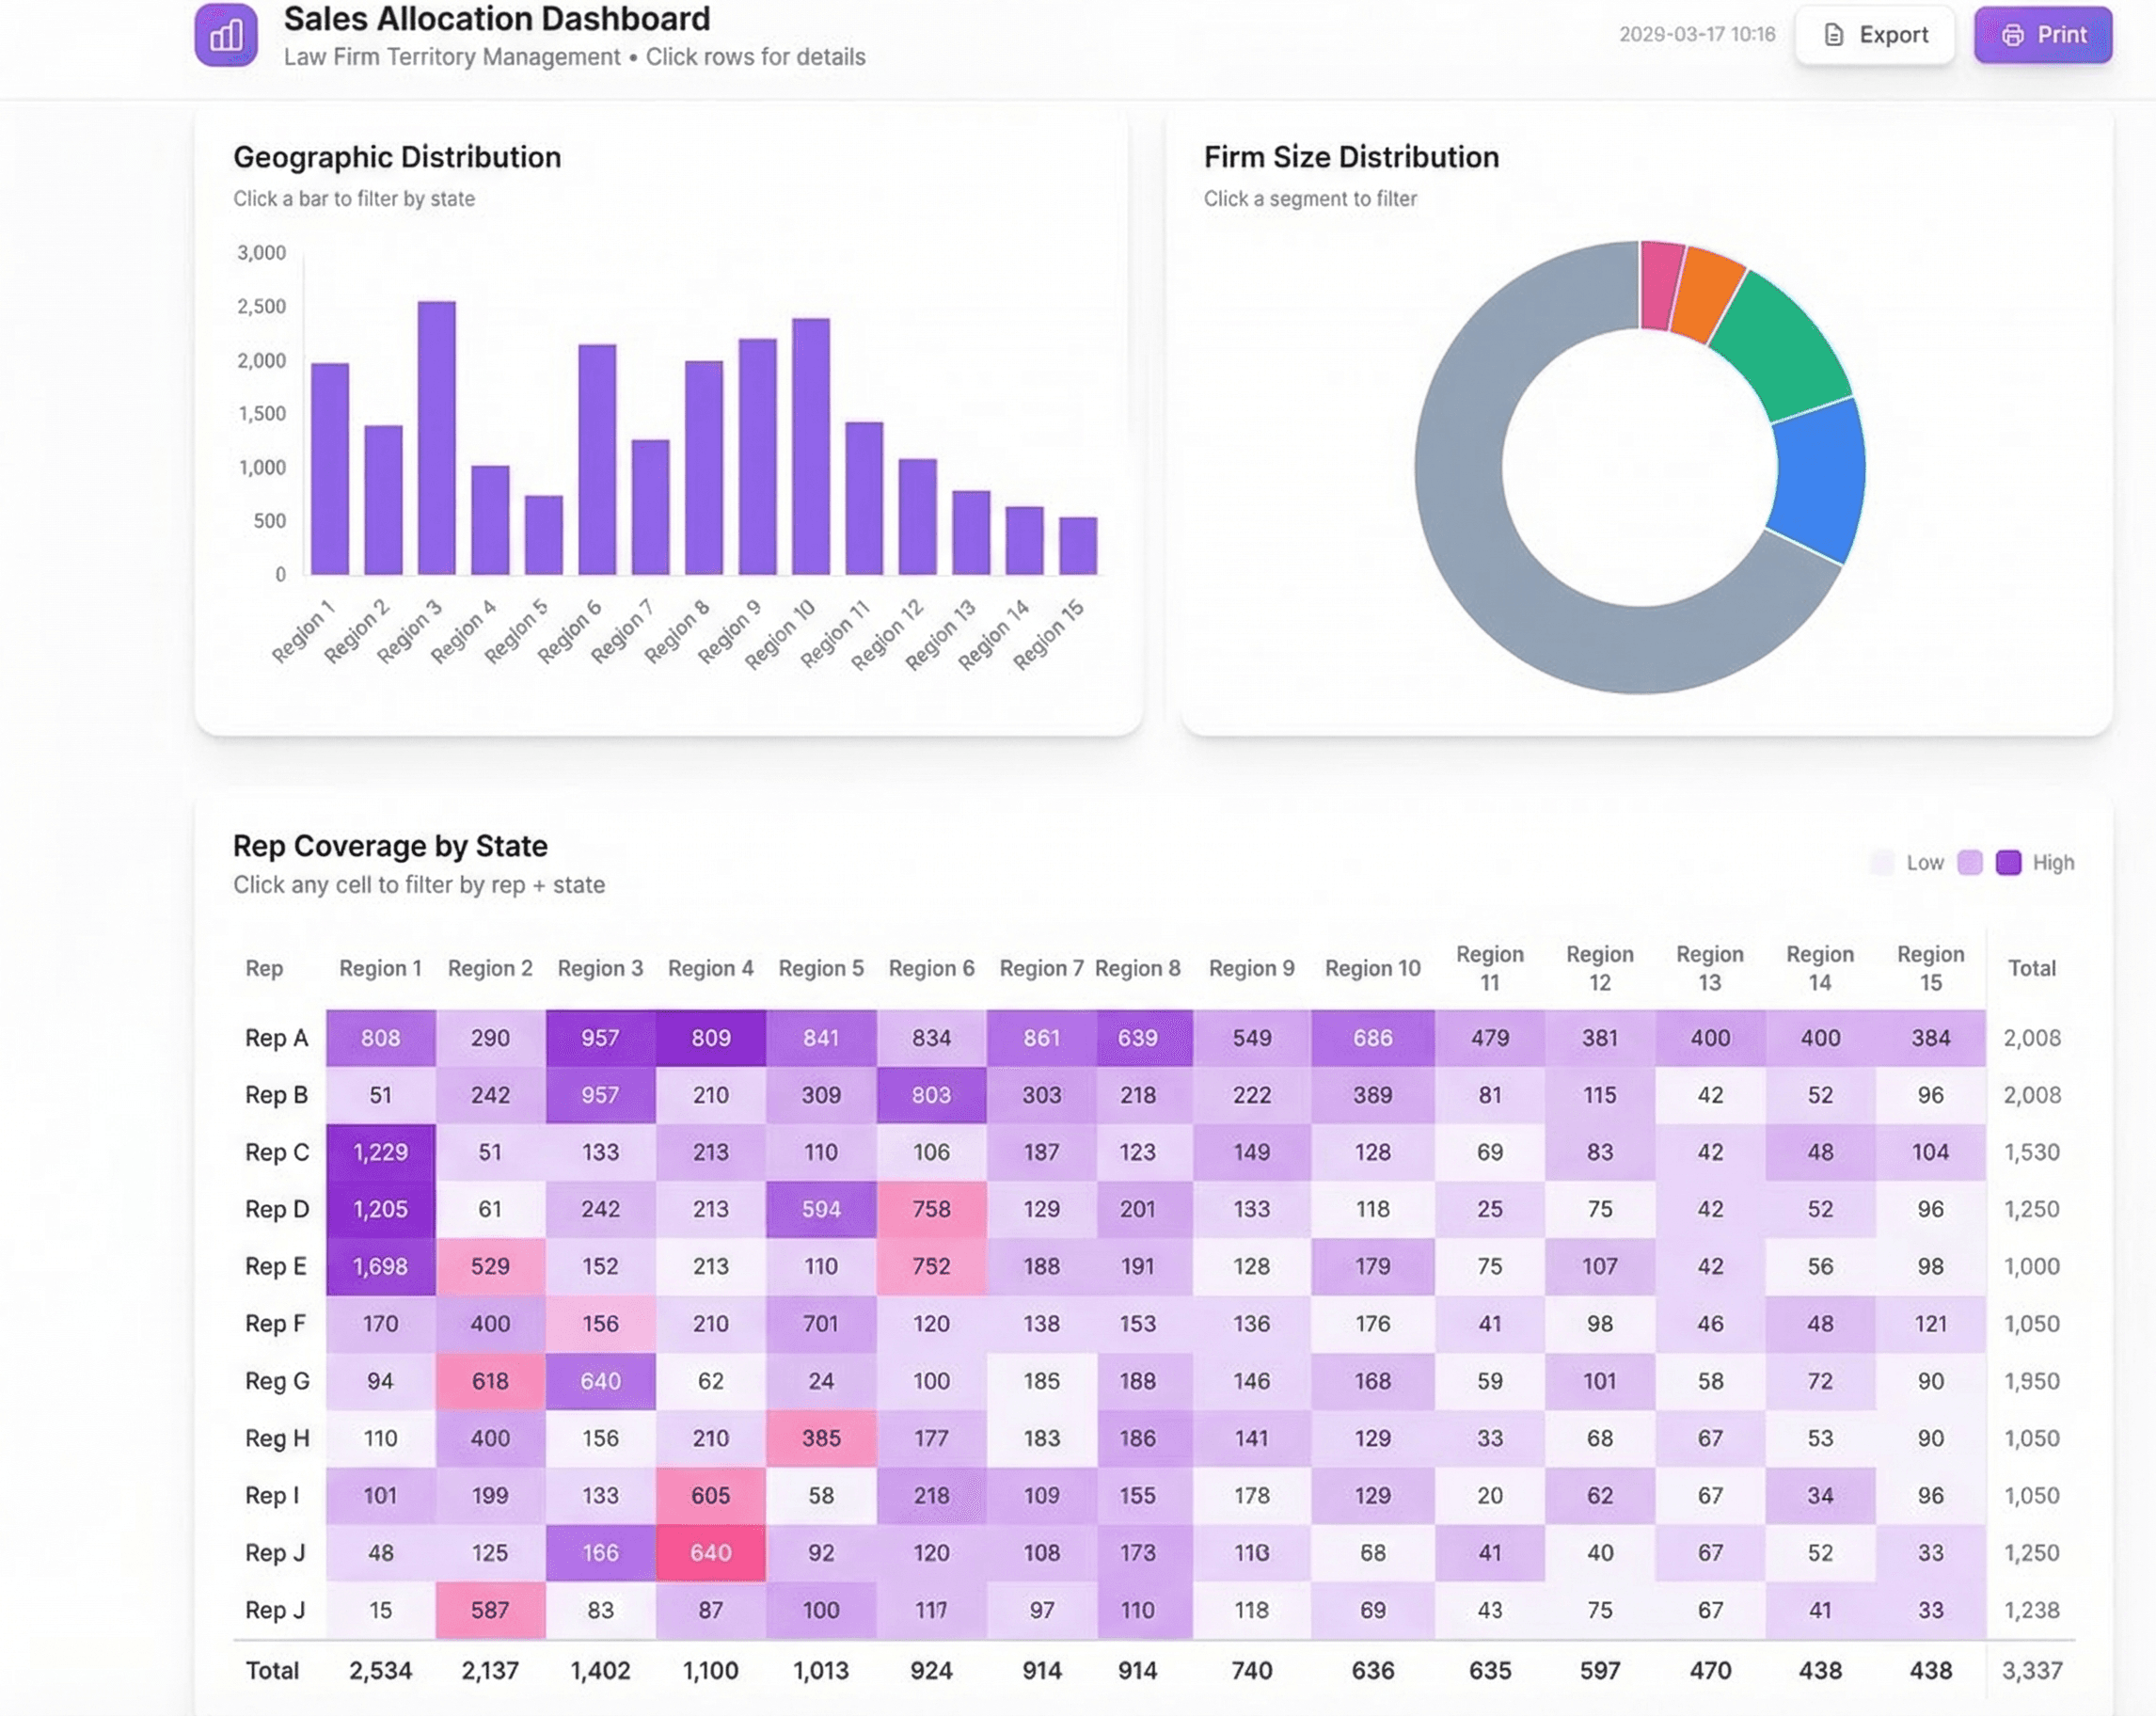
The merchant table is where the operations team spends most of their time. Every merchant row shows current month revenue, trailing 3-month average, growth rate, and a health indicator (growing, stable, declining, at-risk). The table is fully sortable, filterable, and exportable. Finding merchants in a specific region with declining revenue takes a few clicks instead of a custom VBA modification.
The prospecting map visualizes merchant locations and identifies geographic whitespace. Dense clusters indicate strong market presence, while empty areas represent expansion opportunities. The map overlay includes demographic and industry data to help prioritize which areas to target first.
Historical data loads from the previous 24 months enable trend analysis that the old system never supported. The team can now see how individual merchants have performed over time, identify seasonal patterns, and spot early warning signs of attrition.
Results
Processing time dropped from 45 minutes (with manual oversight) to 30 seconds (fully automated). The monthly cycle of importing, processing, and reporting now happens the same day the data file arrives instead of taking 2-3 days.
The key-person risk was eliminated entirely. The dashboard runs on documented, version-controlled code instead of undocumented VBA macros in a single Excel file. Any developer can maintain or extend it.
Within the first quarter, the merchant health analysis identified dozens of merchants showing early-stage attrition patterns (declining volume over 3+ months). The sales team reached out proactively and retained the majority. Under the old system, declining merchants weren't flagged until they had already left or reduced volume significantly.
The geographic analysis revealed several metro areas where the client had no merchant presence despite strong market indicators. The sales team opened new markets within six months, adding significant annual recurring revenue that wouldn't have been identified without the whitespace mapping.
Product Screenshots
Need something like this built?
I build custom dashboards and analytics tools for finance teams. Let's talk about what you're working with.
Book a 30-Minute Conversationor email us at hello@strategiq.so